
We released our 2020 second quarter Air Quality Health Index (AQHI) results and a COVID-19 impact assessment today. The Government of Alberta calculates the AQHI using data collected at seven of FAP’s air monitoring stations.
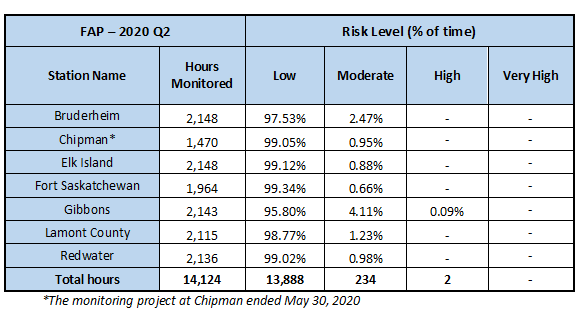
There were only two hours of high or very high AQHI results for the entire calendar quarter. Overall air quality in and around Alberta’s Industrial Heartland was of low risk to health nearly 96% of the time from April 1 to June 30, 2020. The air monitoring station at Gibbons recorded the most hours of moderate or high AQHI results while the portable at Chipman recorded the least although Chipman ceased monitoring operations on May 30, 2020.
As a comparison, results from the second quarter of 2019 are shown here.
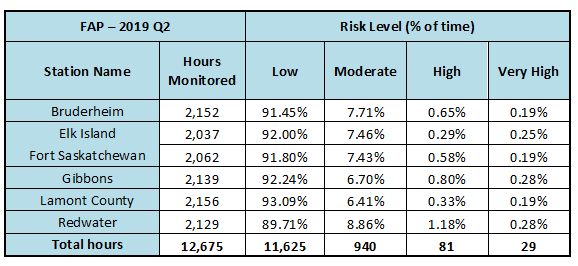
The major difference in results between the second quarters of 2020 and 2019 can be attributed to the large amount of smoke that occurred in Q2 of 2019, predominantly from wildfires burning in northwestern Alberta.
Cursory COVID-19 Air Quality Impact Assessment
A cursory assessment of air quality data at our Fort Saskatchewan station was conducted to determine if the COVID-19 pandemic restrictions had any impact on air quality. The comparison looked at daily averages, which were then averaged out over each of the months of March, April and May. They were then compared to 2013-2019 historical averages for each month for key substances used in the Air Quality Health Index calculation. The following was observed:
- Nitrogen Dioxide (NO2) – 2020 daily averages were quite a bit lower than historical averages. March levels were 27% below the historical average, April levels were 29% below the historical average, and May levels were 47% below the historical average. The significant difference is likely due to a decrease in traffic after March 15 when COVID-19 restrictions came into effect.
- Fine Particulate Matter (PM5) – 2020 data is slightly lower but tracks more closely to the historical average.
- Sulphur Dioxide (SO2) – 2020 data compares to historical values. Daily averages are very similar to any previous year.
- Ozone (O3) – 2020 data is similar to historical averages.
A more complete assessment for the province is planned to be released later this year.